
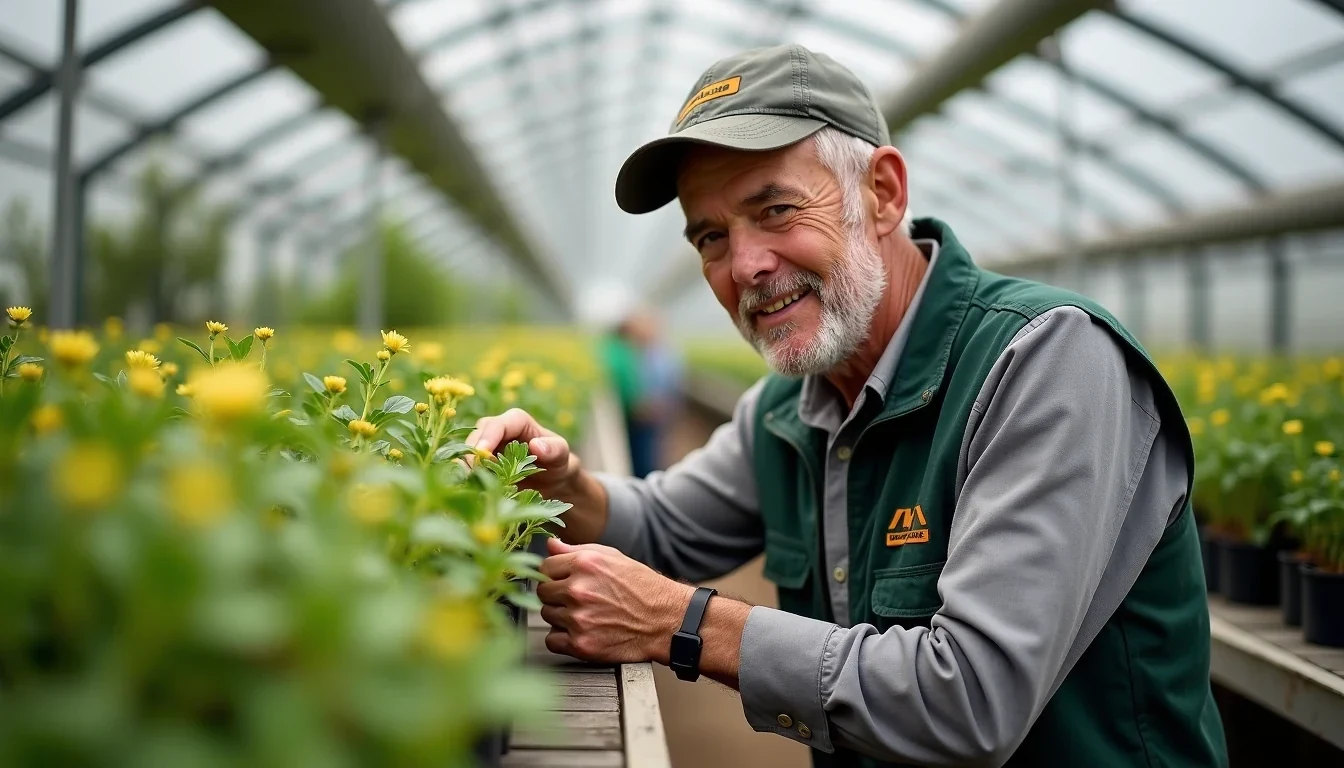
The first time the alert came through, Marius de Beer ignored it. His phone pinged at 6:47 on a Tuesday morning with a thermal-camera flag from Bench 14, Row C: temperature differential suggesting early moisture stress in a block of Pelargonium zonale plugs. The plants looked fine. His night scout had walked that same row eight hours earlier and seen nothing. Three days later, the first faint halo of Botrytis appeared on the leaf margins. By Friday, de Beer had pulled 340 trays.
That was March last year, at his family’s propagation nursery outside Stellenbosch. The camera system had been running for six weeks, and de Beer was still treating its pings as suggestions rather than instructions. The Botrytis incident changed his rhythm. Now he walks to the flagged bench first, before coffee, before the morning meeting with his section leaders. The camera tells him where to point his eye.
What the cameras actually see
The hardware is unglamorous: fixed-mount RGB and thermal sensors on irrigation booms, plus two autonomous units on ceiling rails that traverse the 2.4-hectare tunnel complex every four hours. The machine-learning model was trained on three seasons of de Beer’s own crop images, not a generic greenhouse dataset from the Netherlands. This specificity allows the system to identify a Pythium infection in his coir-based plugs, which presents differently than the same pathogen in rockwool. The system learned the particular yellow-grey cast that Pythium takes against his light mix, the way his irrigation timing creates false positives from recent watering, and the thermal signature of a healthy Pelargonium canopy at 11am versus 3pm.
The cameras flag five categories: fungal and bacterial disease, pest presence, nutrient stress, water stress, and growth unevenness. The growth metric initially sold de Beer. His nursery produces 4.2 million plugs annually, and his wholesale customers reject batches where more than 8% of plants fall outside size specification. Human scouts sample roughly 3% of trays and estimate the rest. The cameras measure every plug, every cycle, and build a uniformity map that de Beer now emails with each delivery note. His rejection rate dropped from 6.3% to 1.8% in the first full season.
The six-month trial nobody wanted
The pilot ran from March to August 2024, structured as a head-to-head comparison. De Beer’s agronomist, Dr. Lindiwe Mokoena from Stellenbosch University, insisted on this before she would endorse the capital outlay. The protocol was strict. Two identical tunnel sections, each 0.4 hectares, were planted with the same Pelargonium cultivar on the same day. Section A got camera monitoring plus normal human scouting. Section B got human scouting only, but intensified: twice-daily walks instead of once, with Mokoena herself spot-checking twice weekly.
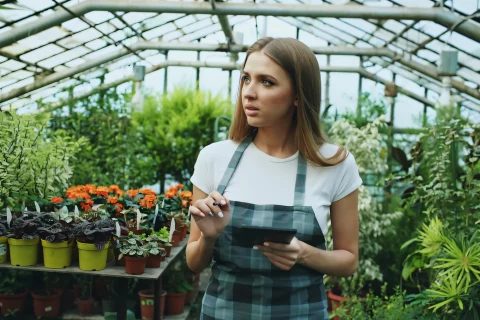
The human scouts were experienced. Two women, both with more than five years in the nursery, were familiar with the crop’s normal behaviour. They carried tablets and logged every observed anomaly with GPS coordinates and photographs. Mokoena collected their logs daily and compared them against the camera system’s automated alerts, plus her own weekly inspections as a tiebreaker.
The results embarrassed everyone slightly. Across 23 disease or stress events that Mokoena confirmed as genuine, the cameras flagged 19 before human scouts noticed symptoms. The average lead time was 3.4 days. In four cases, the scouts found nothing at all; the cameras caught early nutrient deficiency and two incipient Botrytis infections that Mokoena rated as “would have been bench-loss events by weekend.” The humans won on three events: two cases of stem breakage from mechanical damage, which the cameras misclassified as growth anomaly, and one instance of thrips feeding where the scouts identified the pest species while the camera only noted “probable arthropod damage.”
The critical finding was not speed alone, but actionability. The camera alerts include bench, row, and estimated severity. De Beer’s spray team can treat a flagged 15-metre section instead of blanket-spraying a 200-metre tunnel. His chemical spend on Section A was 22% lower than Section B for the six months, and his fungicide applications dropped from 11 to 7 per cycle. The savings on agrochemicals alone are projected to recover the system’s capital cost in 2.7 years at current prices.
The dashboard problem
De Beer has a 55-inch screen in his office that displays leaf-count trends, canopy-volume indices, and spectral reflectance curves. He does not look at it. “Research theatre,” he calls it, with the particular contempt of a man who paid for the theatre. The screen was part of the vendor’s premium package, and it took him three months to realise that his foreman and section leaders were similarly ignoring it. The data was accurate, voluminous, and useless for daily decisions.
The interface he uses is his phone: a simple list, timestamped, with a thumbnail image and a location pin. Green means observe, amber means investigate today, red means act now. He can forward an alert directly to his spray contractor with the bench number already included. This simplicity was not the vendor’s default offering. De Beer demanded it after the first month, when his night manager quit because the original alert system generated 40 notifications per shift and he could not determine which required immediate response.
Mokoena’s academic report frames the distinction precisely. The cameras generate research-grade data as a byproduct of their monitoring function, but the grower’s operational value comes from directional information: where to go, how soon, how certain. A nursery manager making a 6am decision about labour allocation and spray scheduling does not need a leaf-area index. She needs to know whether Bench 14 needs attention before the morning evaporative demand peaks.
What changes in the tunnel
The labour reallocation has been subtler than the marketing brochures suggest. De Beer has not fired scouts. He has redirected two of his four permanent scouts to propagation tasks that require human judgement: taking cuttings, grading finished plugs, managing the misting schedules. The remaining two scouts now work with the camera system rather than parallel to it. Their morning route starts from the overnight alert list. Their expertise has become interpretive: confirming camera flags, investigating false positives, and identifying cases where human pattern recognition still outperforms machine learning.
One scout, Patricia October, has developed particular skill with the system’s uncertainty flags. The model expresses confidence as a percentage, and October has learned which low-confidence alerts to escalate immediately versus which to schedule for her afternoon round. She has become, in effect, a human calibration layer. De Beer raised her wage grade in January.
The growth unevenness detection has also changed his customer conversations. A wholesale bedding-plant buyer in Paarl who previously rejected two consignments annually has now accepted nine consecutive batches with uniformity scores attached. The data does not guarantee acceptance, but it shifts the negotiation from argument to evidence. De Beer knows which customers actually read the uniformity maps and which file them unopened. This knowledge is commercially useful.
The limits and the next season
The system fails predictably. Mechanical damage, as Mokoena’s trial showed, can confuse it. New pest introductions the model has not encountered also pose a challenge. And “happy stress” — the deliberate moisture deficit de Beer applies before transplant to harden his plugs — was initially flagged as drought stress until he trained an override for that growth stage.
The thermal sensors also struggle in the brief midwinter period when his tunnels run heating, creating temperature artefacts that confused the model’s first season. A firmware update in October addressed most of this, but de Beer still disables thermal monitoring for six weeks around the winter solstice.
He is expanding to his vegetable seedling section this spring, starting with Brassica and solanaceous crops. The model needs retraining for these canopies, a six-week process using his historical images plus deliberate inoculation with common pathogens under controlled conditions. Mokoena is supervising this phase. De Beer pays her as a consultant now, no longer through university grant channels. The relationship has become commercial, which he prefers. “When she answers the phone, I know she’s not doing me a favour,” he says.
The camera vendor has offered him a case study for their marketing, with his name and nursery identified. He refused. His competitive advantage is the three-season dataset and October’s interpretive skill, not the hardware itself. The next nursery down the R44 could install identical cameras tomorrow and get worse results for eighteen months while the model learned local conditions. De Beer intends to maintain that gap.